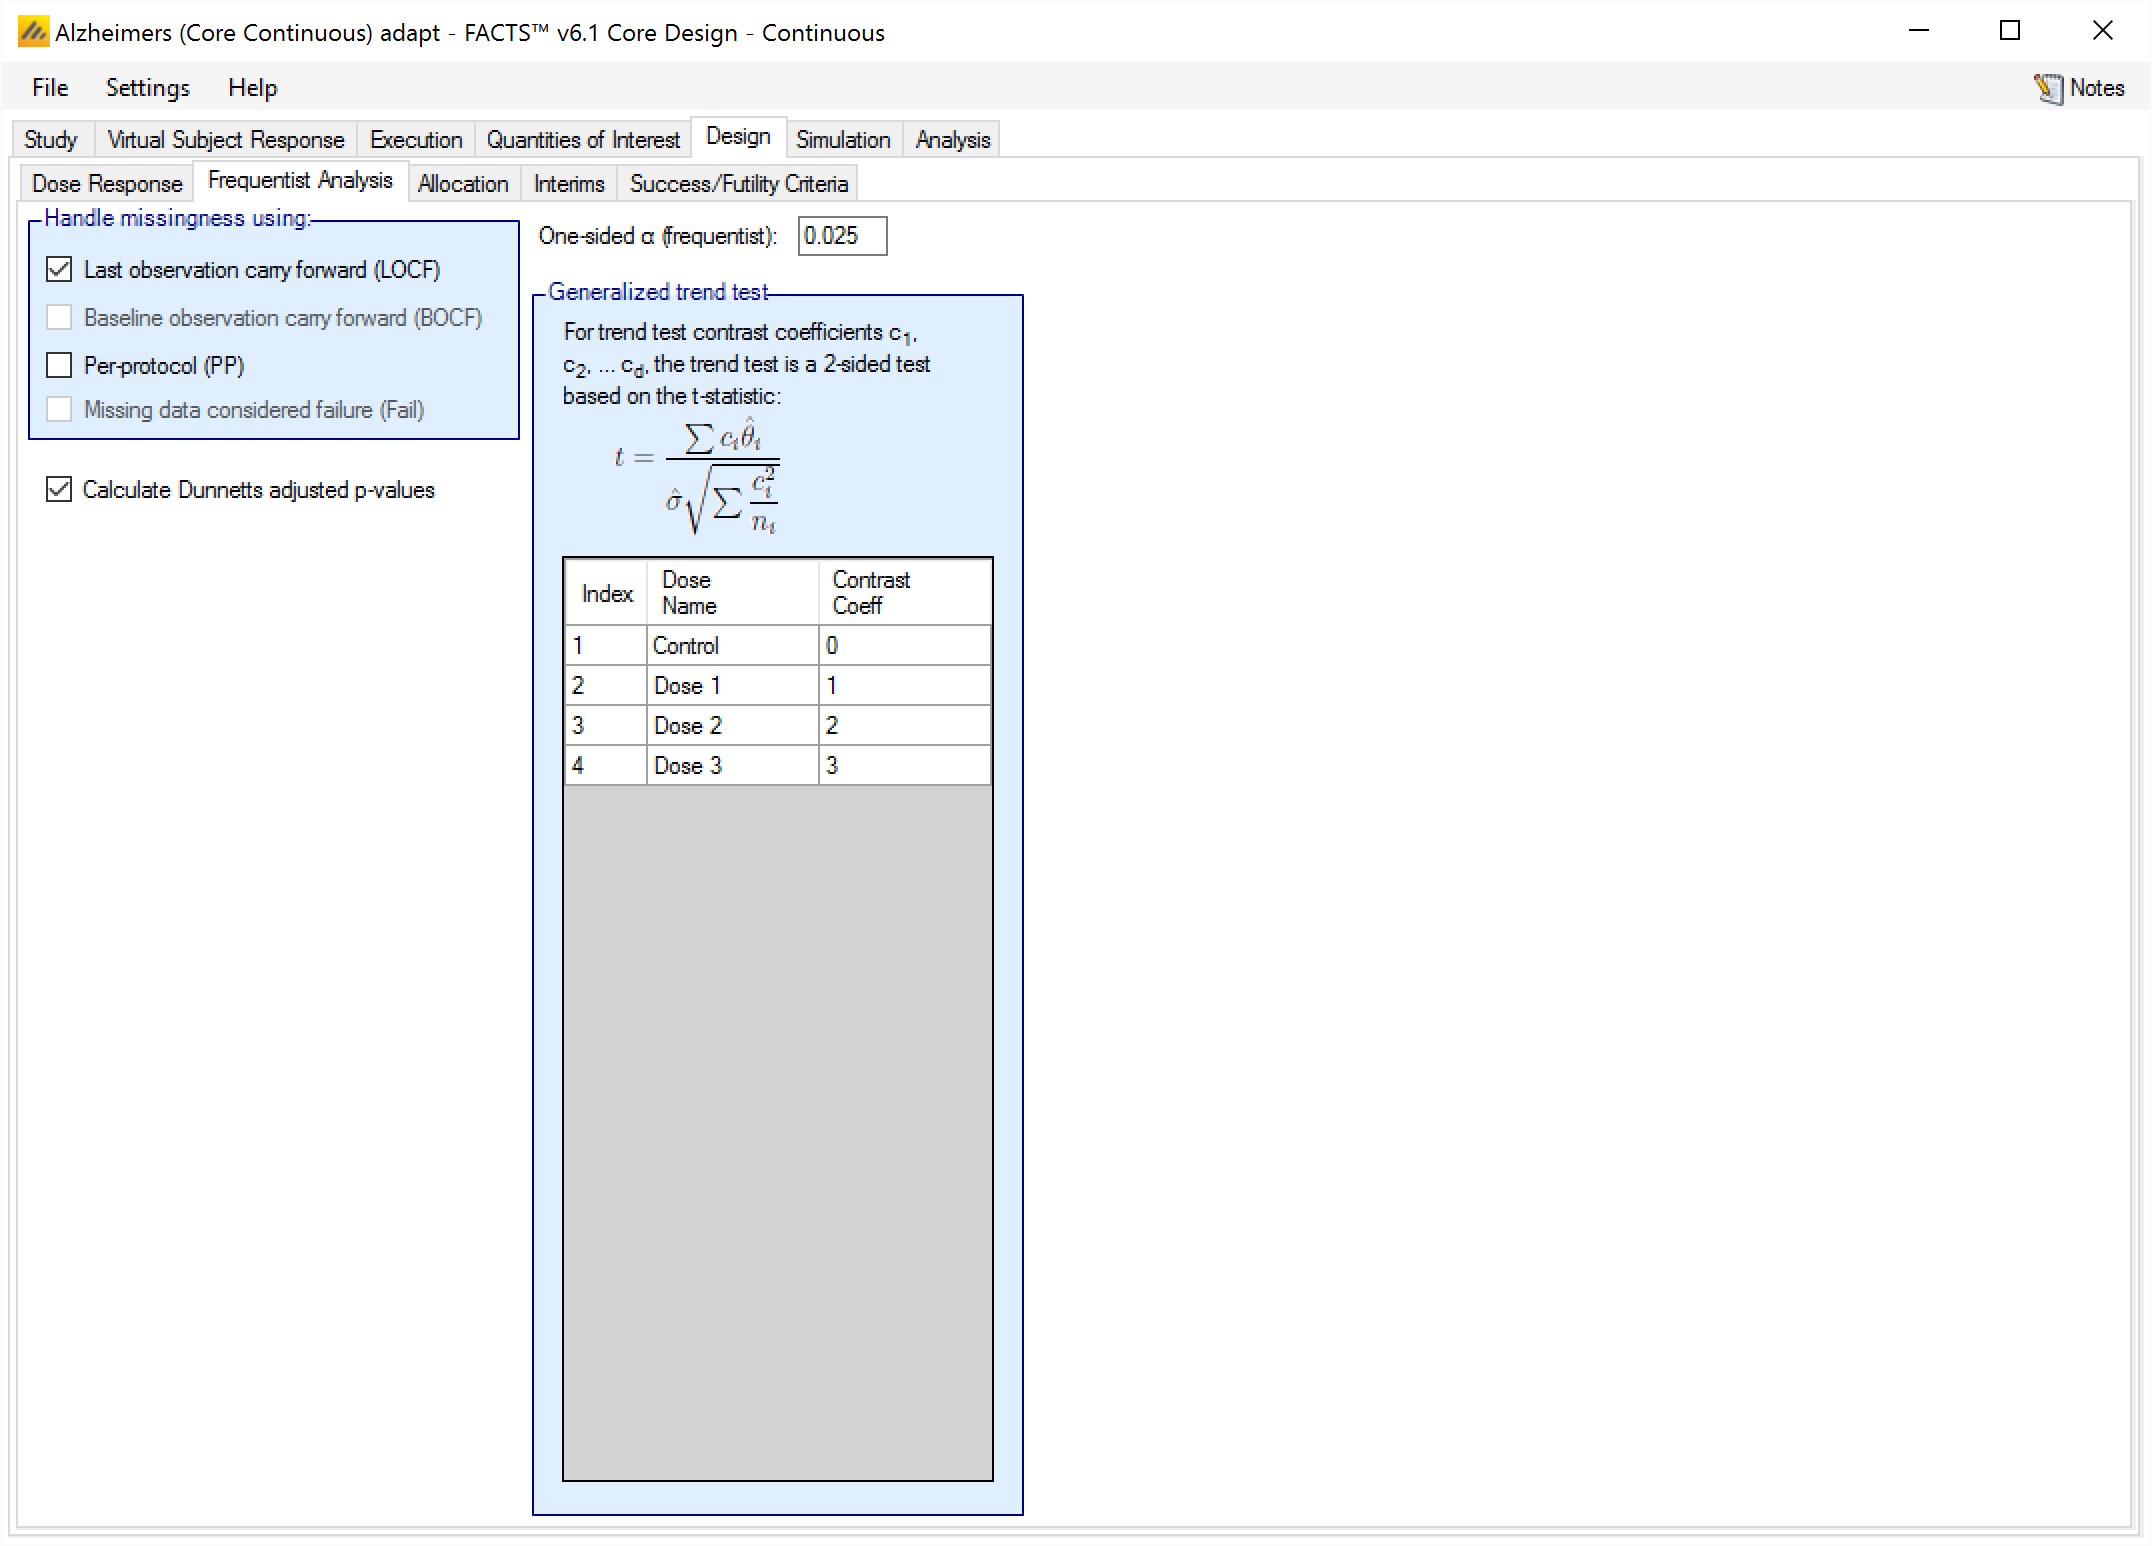
On the Frequentist Analysis tab the user can specify that some standard frequentist analyses be performed at trial analyses. The frequentist analysis tab is completely separate from, and independent of, any p-value QOIs that have been defined. The analyses specified on this tab cannot be used for simulated trial decisions - they are for storing in output only.
Each specified analysis can be conducted using a variety of ways of handling missingness. Select all ways of handling missingness that are desired:
Missing data replaced by last observation carried forward (LOCF)
Missing data replaced by baseline observation carried forward (BOCF). This is only available if the endpoint is continuous and Baseline is being simulated.
Missing data is ignored (a “per-protocol” analysis).
Missing data is treated as a failure. This is only available if the endpoint is dichotomous.
If the trial has interim analyses, then for the simulations for which frequentist weeks files are to be output (specified on the Simulation tab) the standard frequentist analyses will be performed. If the trial has p-values QOIs, those QOIs are calculated every interim in all simulations.
Having the frequentist analysis include Dunnett’s adjusted p-values is a separate option (that applies to all the analysis type requested) because of the significant run-time overhead this can entail. Dunnett’s adjustment is available for continuous and dichotomous frequentist analyses.
The frequentist analysis tabs for the continuous and dichotomous engines also have trend tests, and allow the user to specify contrast coefficients to conduct those tests.
Note that the reported frequentist estimates of the treatment effect take the specified direction of response on the Study tab (whether a response indicates subject improving or worsening) into account. They are adjusted so that a treatment that is estimated to be better than the control always has a positive treatment effect.
Continuous Endpoints
At the end of each simulated trial the following frequentist values will be calculated for each missingness handling method checked:
Using unadjusted dose-placebo comparisons based on a two-sample t-test calculate the:
test statistic,
(p-value)[## “1-sided p-value is reported in all the frequentist results. This is done in order to be consistent with comparisons with 1-sided α-values elsewhere.”],
confidence interval for the mean difference,
for each dose its marginal probabilities of significance (the number of times it was significantly separated from placebo independent of whether any other doses were) .
If selected, using Dunnett-adjusted dose-placebo comparisons based on a two-sample t-test calculate the:
test statistic,
p-value,
confidence interval for the mean difference
for each dose its marginal probabilities of significance (the number of times it was significantly separated from placebo independent of whether any other doses were) .
Using the general trend test calculate the t-test statistic and p-value using user supplied contrast coefficients.
If neither placebo nor an active comparator are simulated, a difference from 0 is assessed for each dose arm and Dunnett-adjusted calculations are not carried out.
If high values of the endpoint are good, P-values are calculated using a one-sided t-test testing \[H_0: \mu_T < \mu_C\] against \[H_1: \mu_T \ge \mu_C\] with \(\mu_T\) being the true treatment response mean and \(\mu_C\) being the true control response mean. If low values of the endpoint are good, then the signs of the hypotheses are flipped.
Dichotomous Endpoints
At the end of each simulated trial the following frequentist values will be calculated for each missingness handling method checked:
Using the methodology described by Agresti, Mee and Nurminem for comparing the difference of proportions:
test statistic,
p-value,
95% confidence interval for the difference in proportions,
marginal probabilities of significance.
If checked, using Dunnett-adjusted dose-placebo comparisons for comparing the difference of proportions:
test statistic,
p-value,
95% confidence interval for the difference in proportions,
marginal probabilities of significance.
Using the general trend test calculate the t-test statistic and p-value using user supplied contrast coefficients.
P-values are calculated by user choice either using a normal approximation (see previous section on p-value calculations for continuous endpoints) or a Fisher’s exact test, which is a conservative test to test the null hypothesis that the outcome is independent of the treatment assignment. For the normality approximation to have good asymptotic coverage, the expected number of successes and failures under the null hypothesis should be greater or equal to 5 for both groups. In cases where this is not guaranteed, Fisher’s exact test is recommended when strict type 1 error control is required.
If neither placebo nor active comparator are specified, a difference from 0 is assessed for each dose arm and Dunnett-adjusted calculations are not carried out.
Time-to-Event Frequentist Analysis
For each simulated trial, the following frequentist analyses will be performed:
Dose-placebo comparisons based on log-rank test and the Cox proportional hazards model. Summaries include:
The log-rank and Wilcoxon test statistics and the corresponding p-values,
Estimated hazard ratio and its confidence interval from Cox model,
For each dose its marginal probabilities of significance (the number of times it was significantly separated from placebo independent of whether any other doses were, based on the hazard ratio inference from the Cox model).
Median survival times based on the Kaplan-Meier method.
For the predictor, descriptive statistics are computes – a 7 number summary for a continuous predictor, percentages for the dichotomous predictor, and median time, average hazard, and a cox model with predictor as covariate are computed for a time to event predictor.
The following variations for adjusting the alpha level for multiple comparisons should be available using the user-specified 1-sided alpha: unadjusted, and Bonferonni adjusted.