Download the FACTS files used in this tutorial and open them in FACTS with File > Open.
1 Introduction
This is a two-arm randomized phase II trial of a new experiment therapy versus control in patients with triple negative breast cancer who have residual disease following neoadjuvant chemotherapy. The primary objective of this trial is to determine if the new therapy would be of interest for further study, defined as a high probability of superiority for event-free survival (EFS) or a high probability that the observed EFS benefit would translate to superiority in terms of overall survival (OS) in a future phase III trial.
This trial will enroll a maximum of 350 patients with frequent interim analyses to stop the trial early for futility or success. In brief, the trial will stop early for futility if there is a low probability that the new treatment provides a benefit in terms of EFS. This trial may stop early for success if there is both a high probability of superiority in terms of EFS and a high probability of success for the new therapy in terms of OS in a future phase III randomized trial.
2 Entering the Design into FACTS
- Start FACTS, double click on: Core Design – Time to Event.
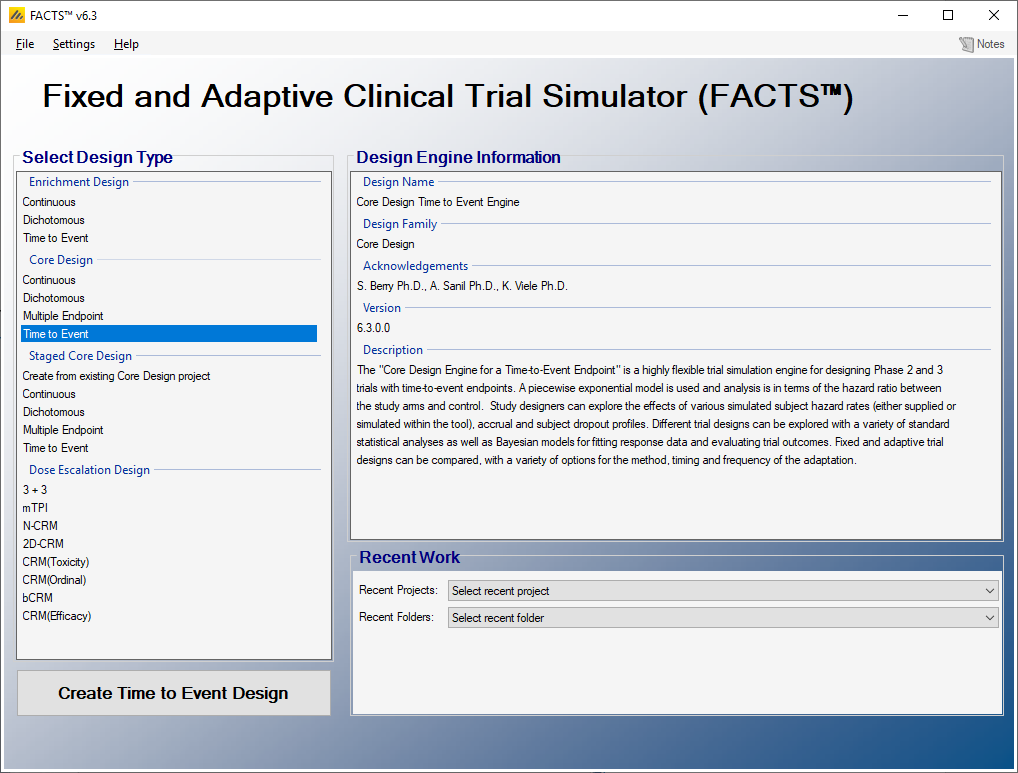
- Using the menu option “File > Save”, save the design as “Core-TTE-Predictor-Ex1” in a convenient location (e.g. in a folder called FACTS\Core-TTE-Predictor-Ex1 in your “My Documents” folder).
2.1 Study Info
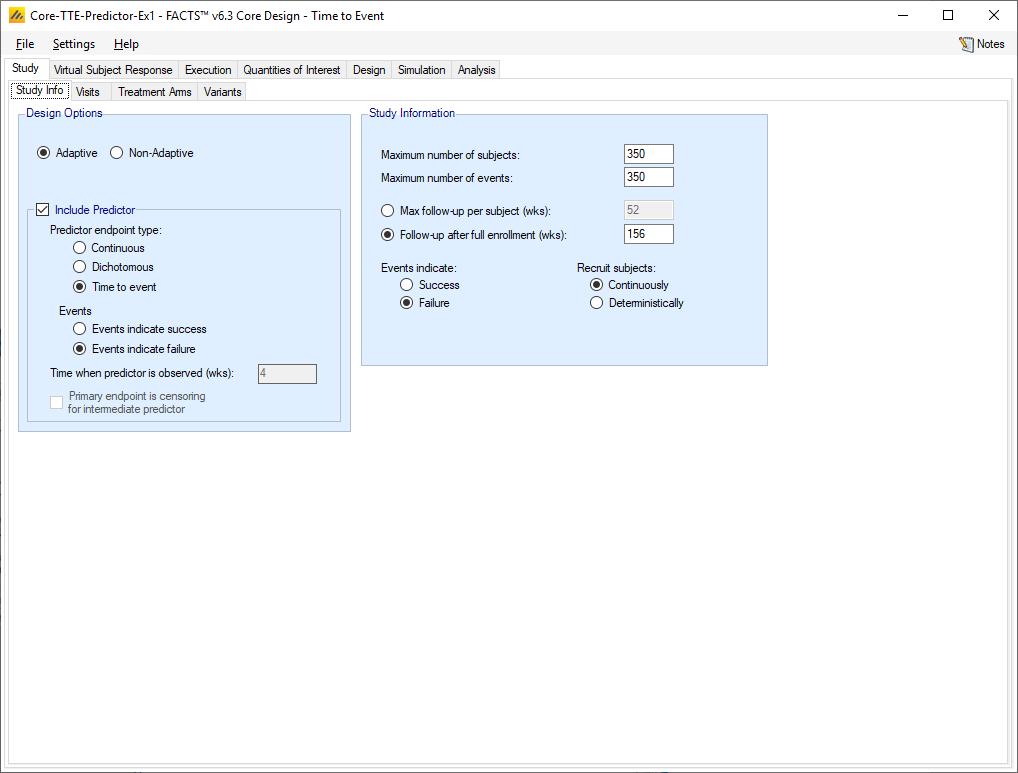
To simulate this trial, we set up a FACTS file for a time-to-event endpoint (OS) with a time-to event predictor (EFS). We indicate that both EFS and OS events are failures. We set the sample size at 350 patients and we will allow a follow-up period of 156 weeks (3 years) after accrual is complete.
2.2 Treatment Arms
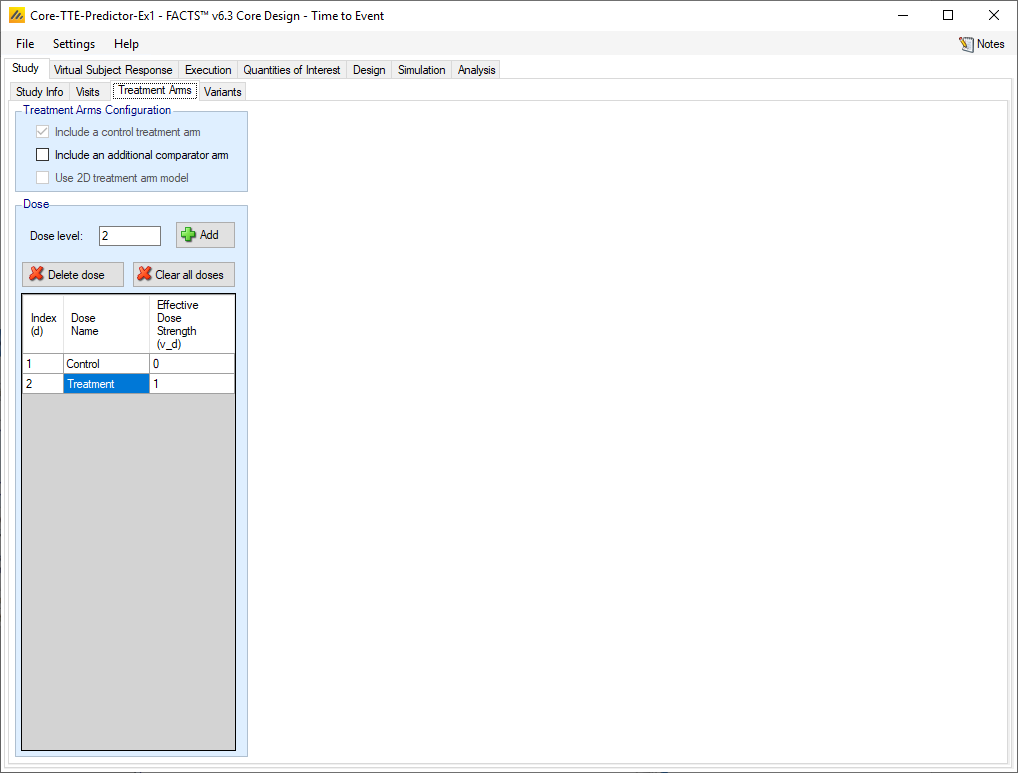
This trial will have two arms, an experimental therapy and a SOC control arm.
Click Add, to add a new Dose, then click twice on the new “Dose 1” to change the default name to “Treatment”.
+
2.3 Virtual Subject Response – Explicitly Defined (Event Rate | Predictor)
2.3.1 Predictor
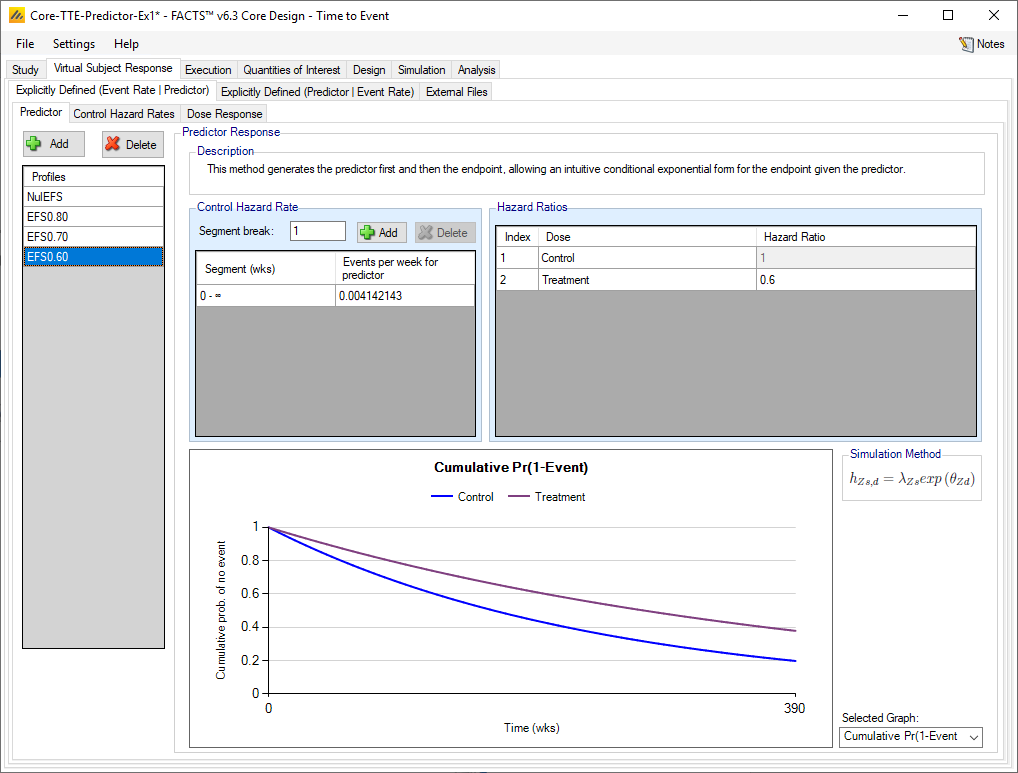
We define the scenarios for EFS as the predictor for the OS endpoint. We define several scenarios for the benefit in terms of EFS – hazard ratios from 1 to 0.6, as in the following table.
For each profile, click Add, then change the default name, and enter the Events per week and the Hazard Ratio.
| Profile | Events per week for predictor | Hazard Ratio |
|---|---|---|
| NulEFS | 0.004142143 | 1 |
| EFS0.80 | 0.004142143 | 0.8 |
| EFS0.70 | 0.004142143 | 0.7 |
| EFS0.60 | 0.004142143 | 0.6 |
2.3.2 Control Hazard Rate
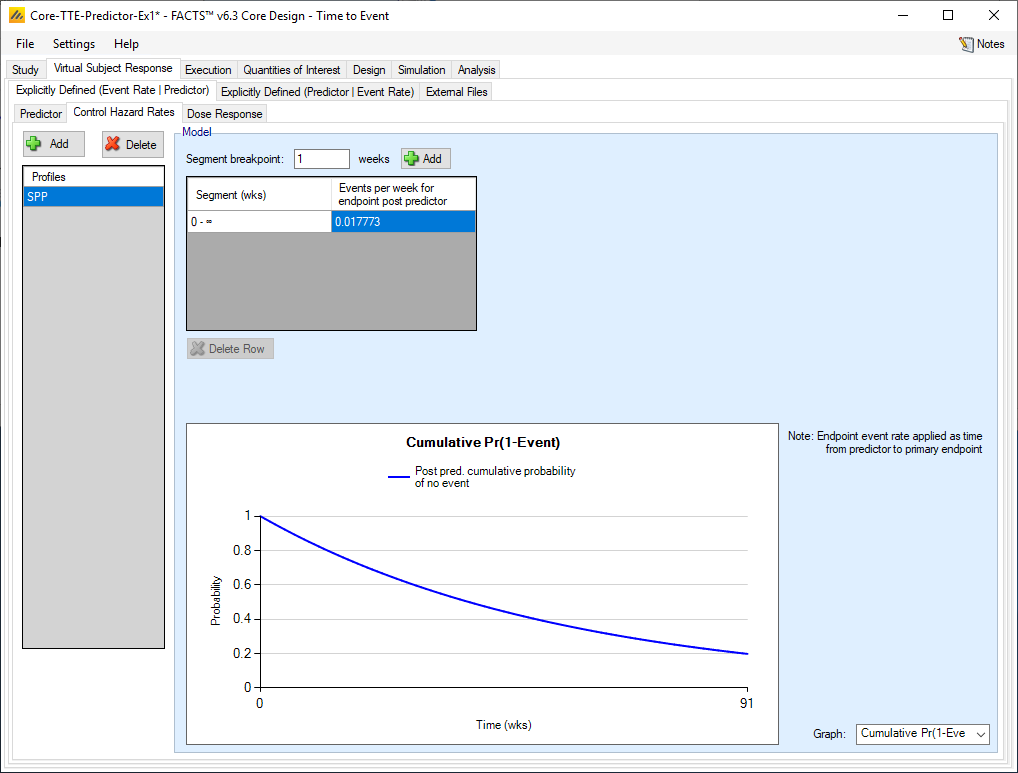
We then define the time from an EFS event to an OS event, referred to as “Survival Post Progression” SPP. We assume that median SPP on the control arm will be 9 months.
2.3.3 Dose Response
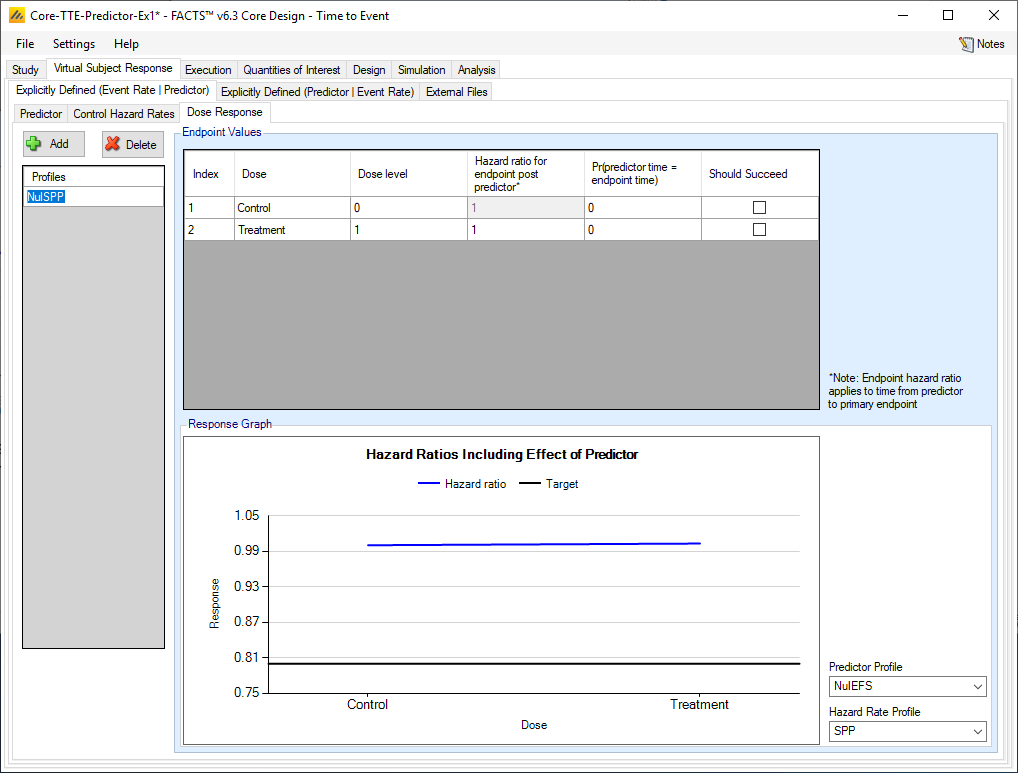
We assume there will be no “Survival Post Progression” SPP difference between treatment and control. Therefore, we define a single hazard ratio scenario for SPP – the null hazard ratio of 1. We assume that no EFS events will be deaths.
2.4 Execution
2.4.1 Accrual
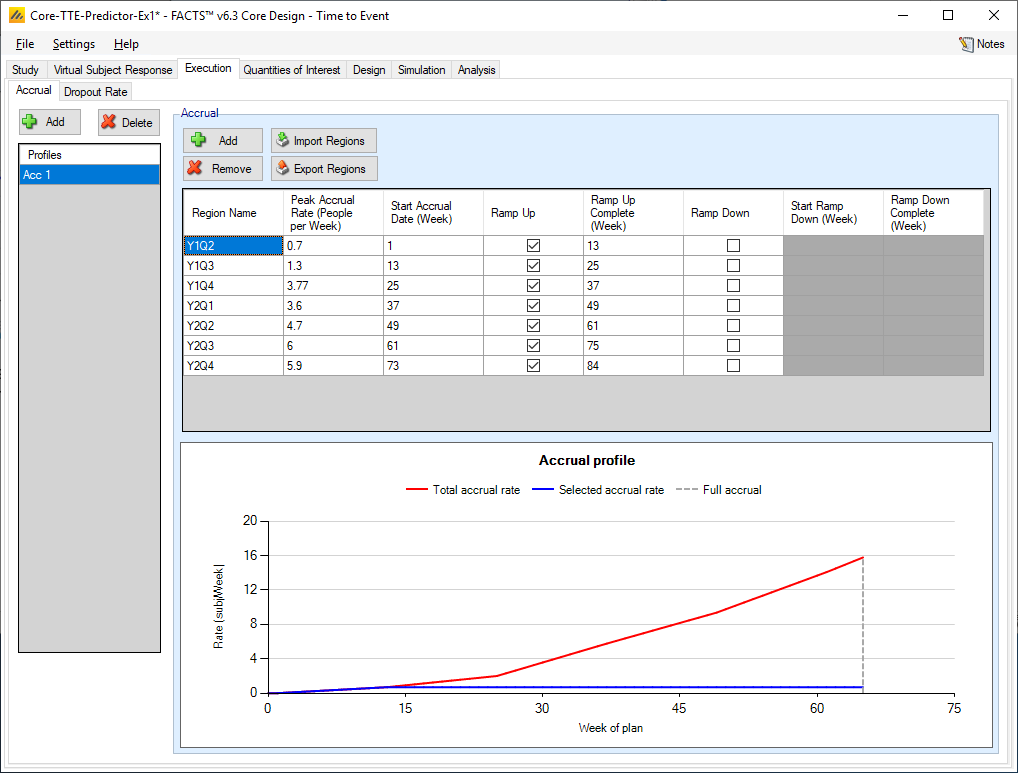
Accrual rates into this trial were provided as peak accrual rates per quarter. We define the peak accrual rate in each quarter and assume a linear ramp up within each quarter to the peak accrual rate.
2.4.2 Dropout Rate
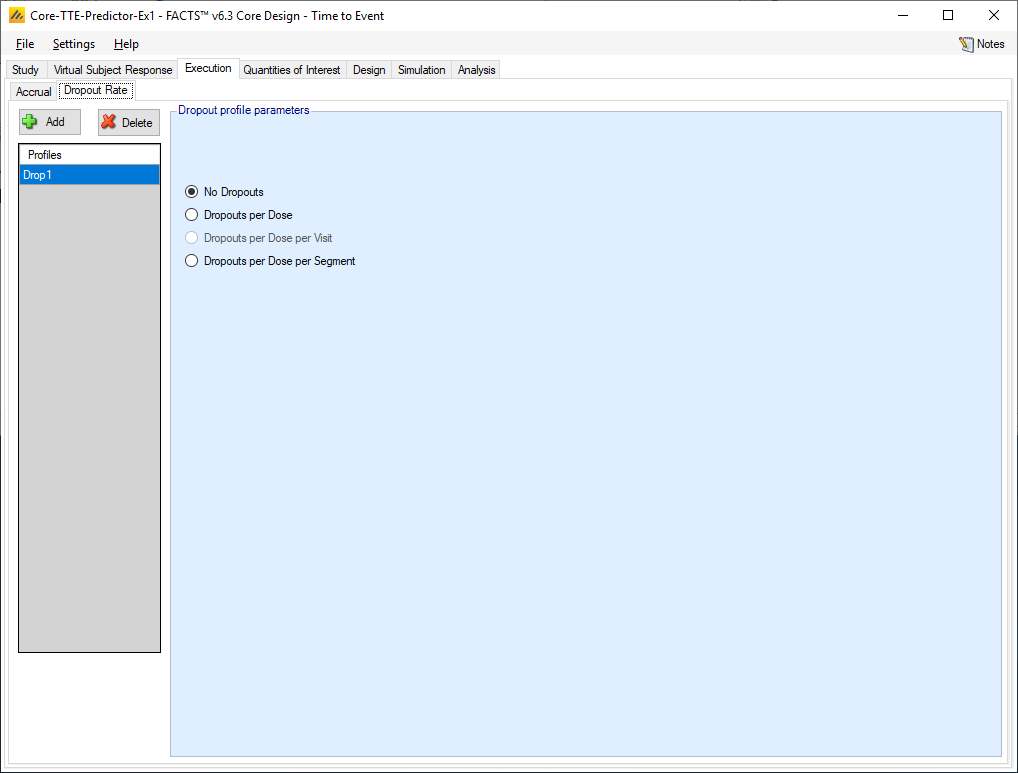
We assume no drop-outs.
2.5 Quantities of Interest
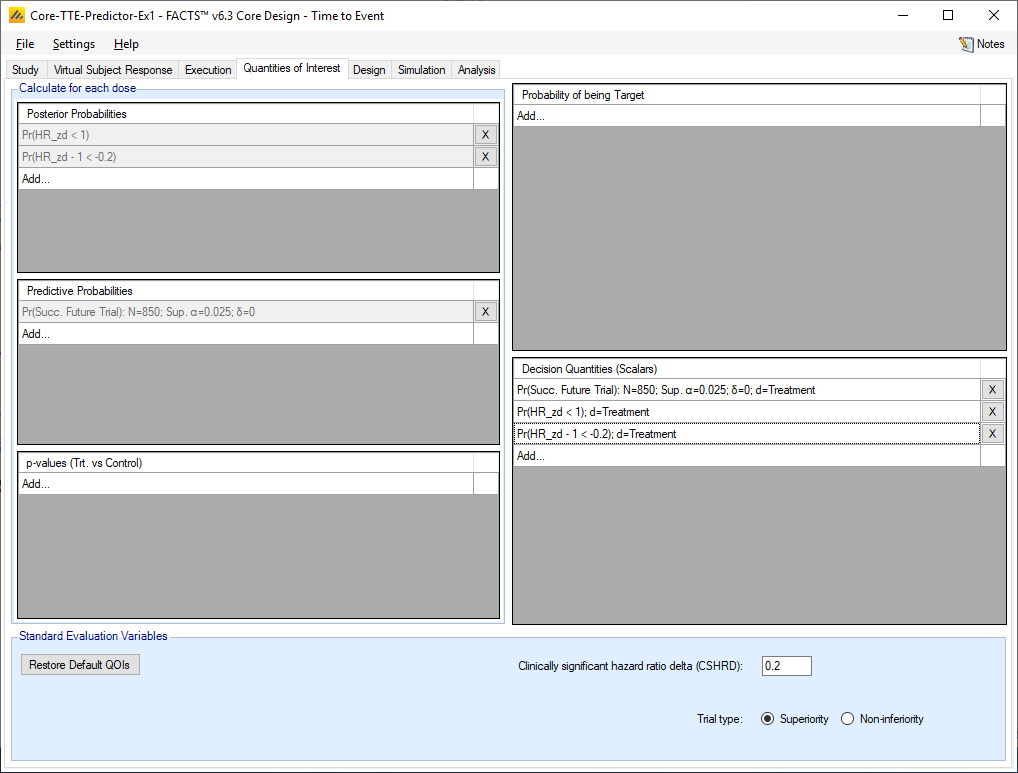
Next, we define the quantities of interest (QOIs) for this trial. Stopping for futility will be based on having a low probability that the experimental therapy is a clinically meaningful improvement over control in terms of EFS. We define the clinically significant hazard ratio as 0.8, and so enter this as the delta of -0.2. Success will depend on having a high probability that the experimental therapy has superior EFS. We define these two quantities of interest in terms of the posterior probability of the new therapy versus control on the predictor variable, EFS (zd). Success will also depend on having a high probability of superiority in terms of OS in a future phase III trial. For our prediction of success in a future phase III trial of OS, we assume a trial with 850 events. A trial of this size would be required in order to have 90% power to detect a HR of 0.80 for OS based on a one-sided test at the 0.025 level. We add the predictive probability of phase III success as a quantity of interest.
2.6 Design
2.6.1 Predictor Model
2.6.1.1 Hazard Model
2.6.1.2 Dose Response
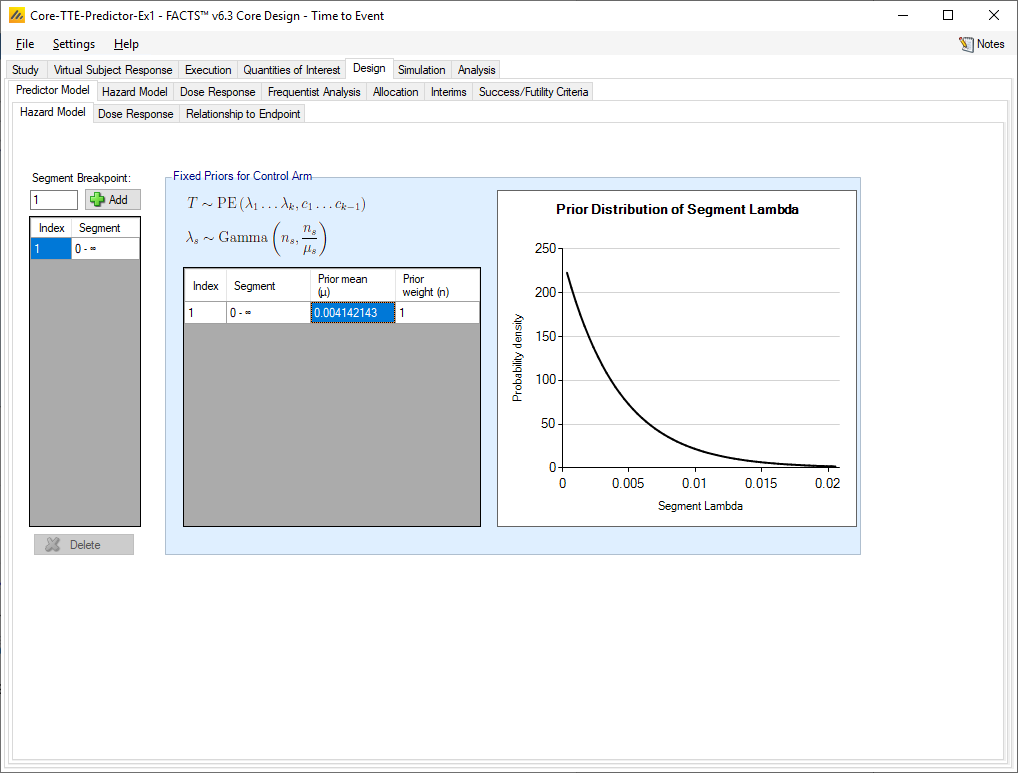
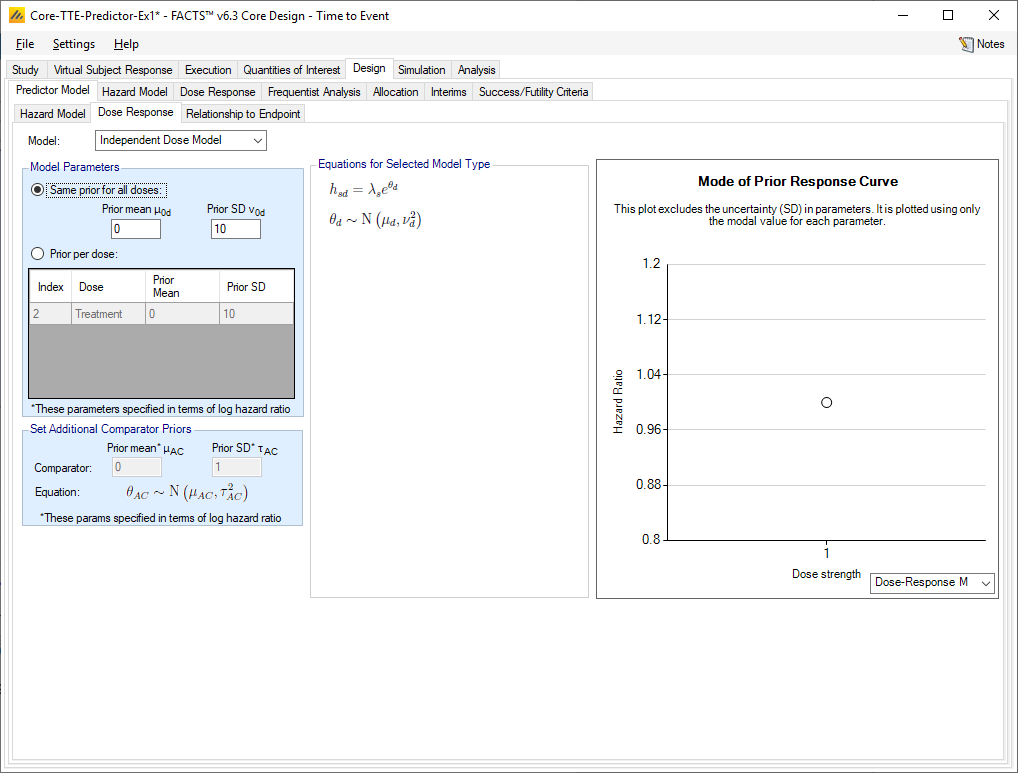
We set the gamma prior distribution for the hazard rate for EFS on the control arm. We give it the same mean as we used in our virtual patient scenarios and a weight of 1. For the dose response model of the predictor, we use the independent dose response and set the prior as mean 0 with SD 10 for both control and treatment.
2.6.1.3 Relationship to Endpoint
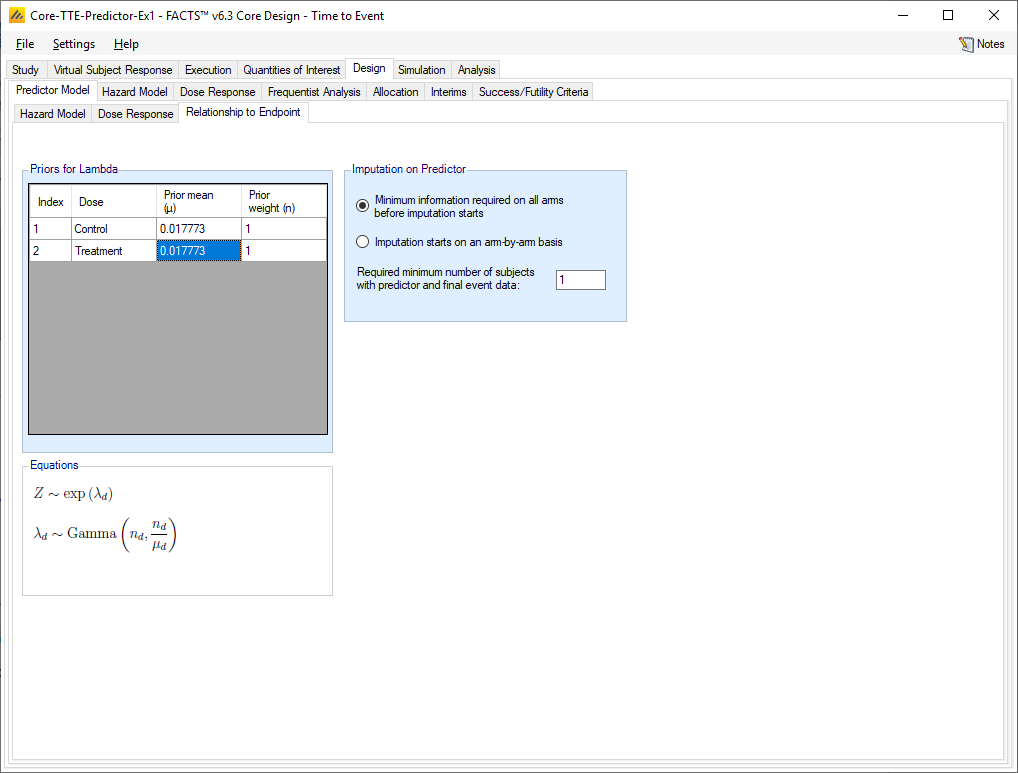
The longitudinal model of OS based on EFS is OS = EFS + SPP. On this tab we set the gamma priors for SPP for treatment and control for the purpose of this longitudinal modelling. We give treatment and control the same prior, with mean equal to the SPP hazard rate we assumed for our virtual patient scenarios. Each prior has weight of 1.
2.6.2 Hazard Model
We now set the gamma prior for the SPP hazard rate. We give this the same prior mean as we defined for our virtual subject response and give it weight 1. We define the dose response model exactly as we did for EFS under the predictor model tab.
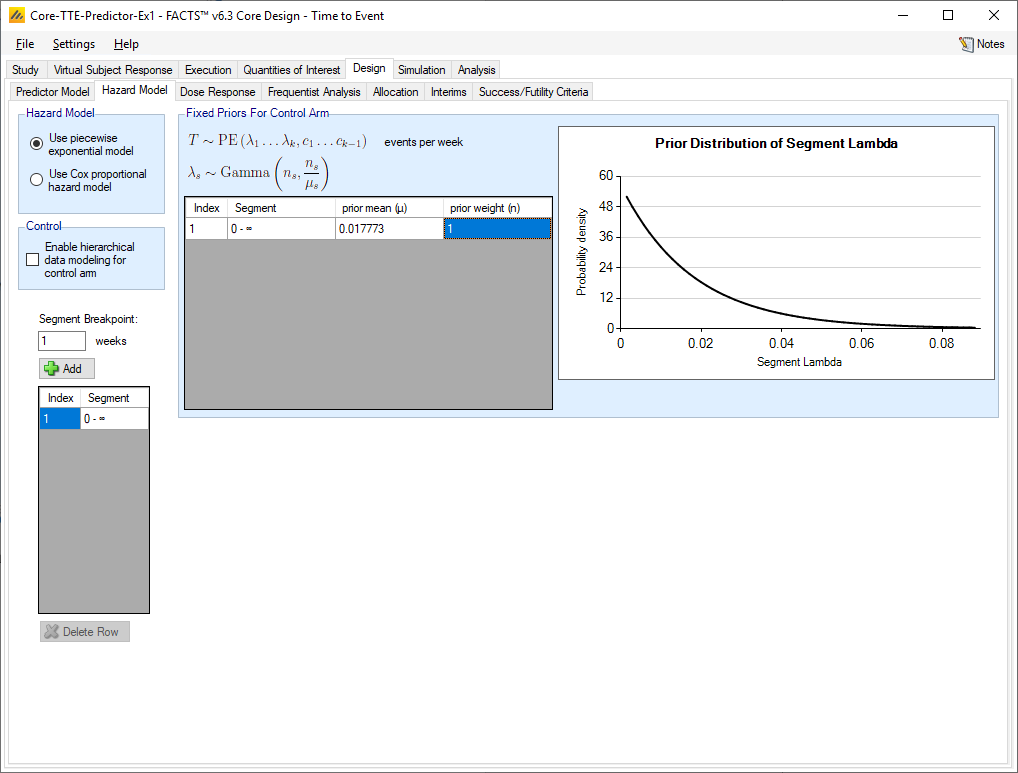
2.6.3 Allocation
This trial will equally randomize all patients between treatment and control.
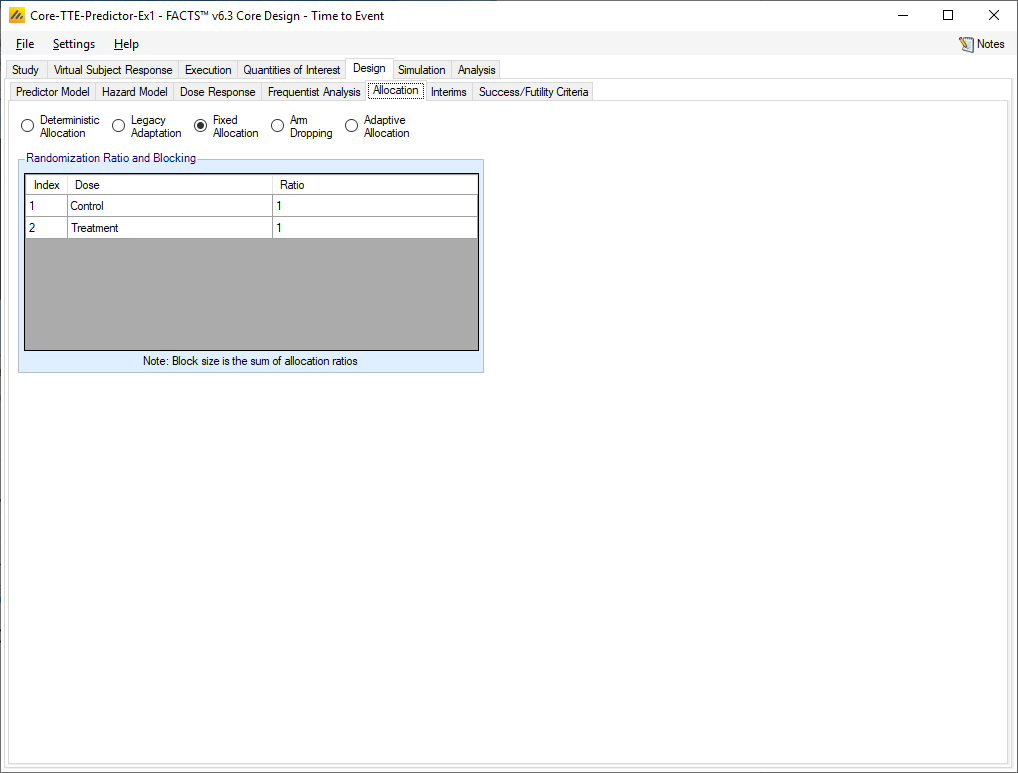
2.6.4 Interims
With 350 patients enrolled within 21 months and an additional follow-up period of 36 months, we expect to observe approximately 175 EFS events and approximately 130 OS events within the maximum duration of the trial. Interim analyses are planned based on the number of observed OS events when approximately 25%, 50%, and 75% of total information on OS has been observed. This corresponds to interims after 32, 65, and 98 OS events have been observed respectively at each interim analysis.
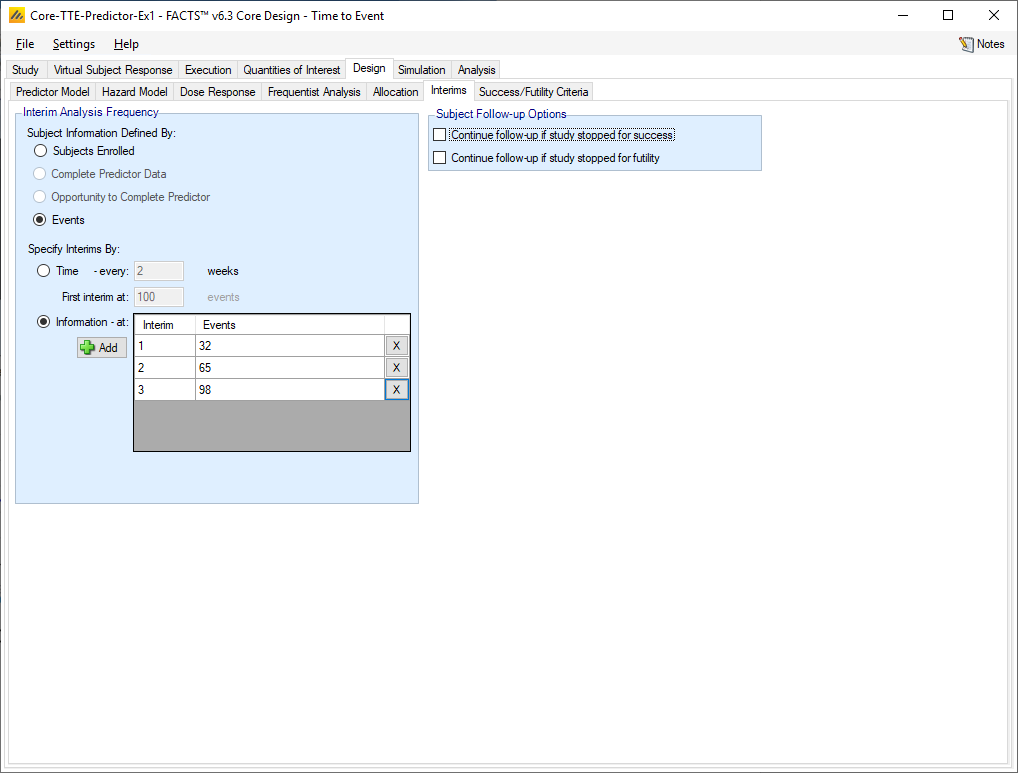
2.6.5 Success / Futility Criteria
2.6.5.1 Interim 1
2.6.5.2 Interim 2
2.6.5.3 Interim 3
2.6.5.4 Final Evaluation
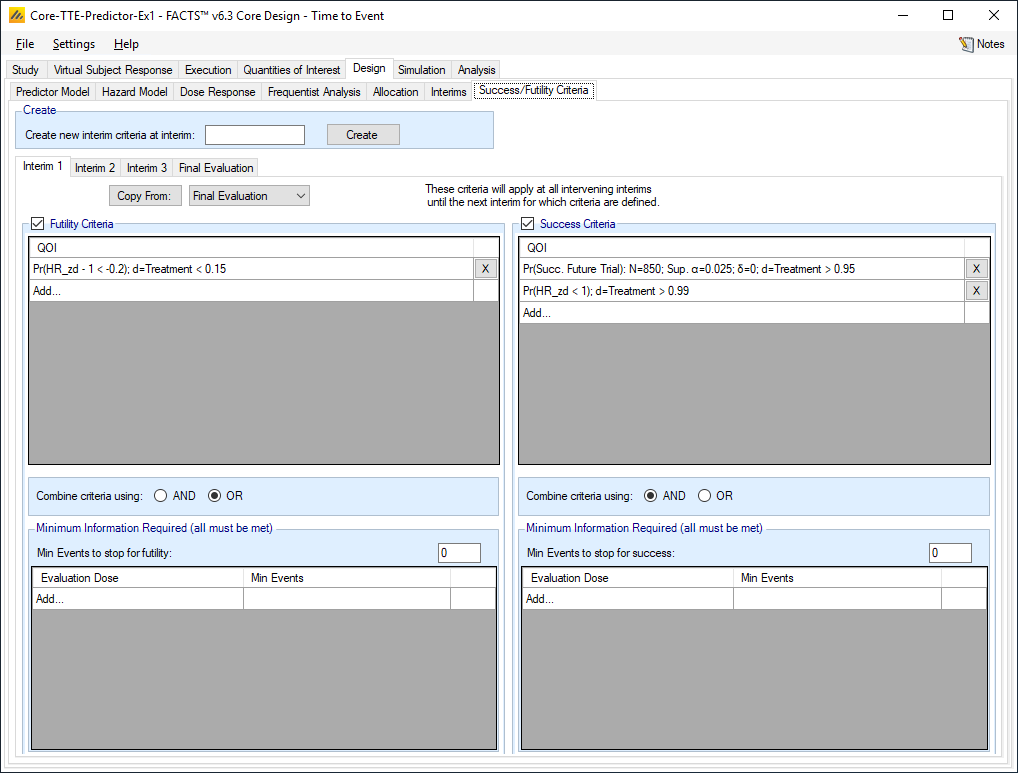
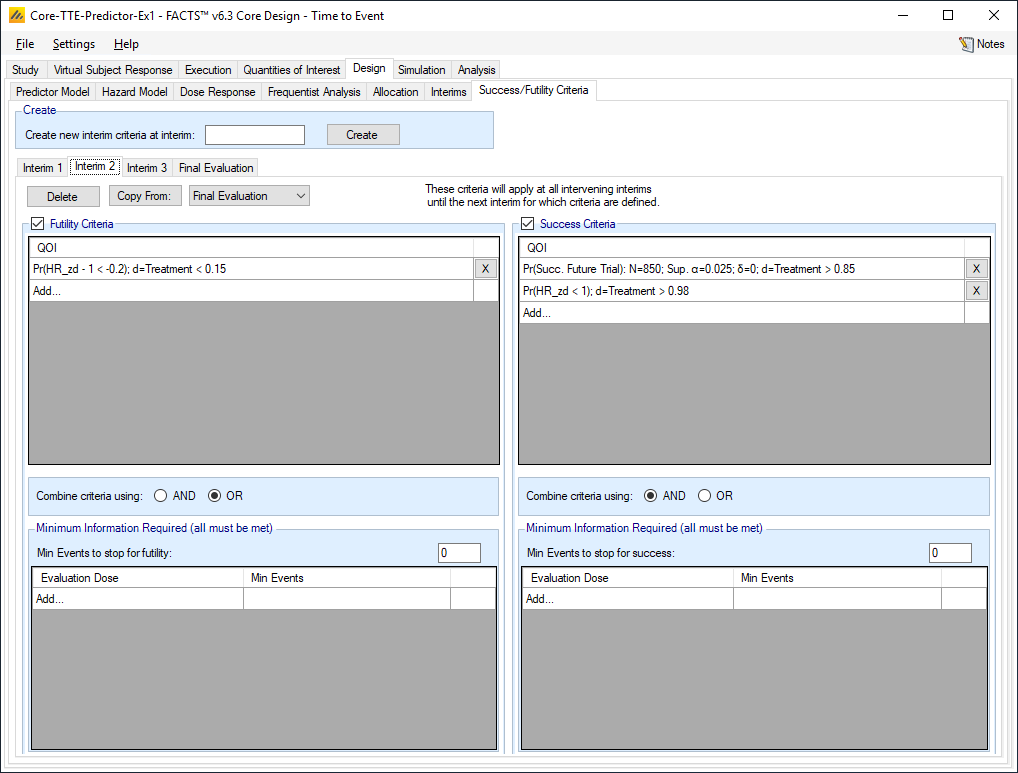
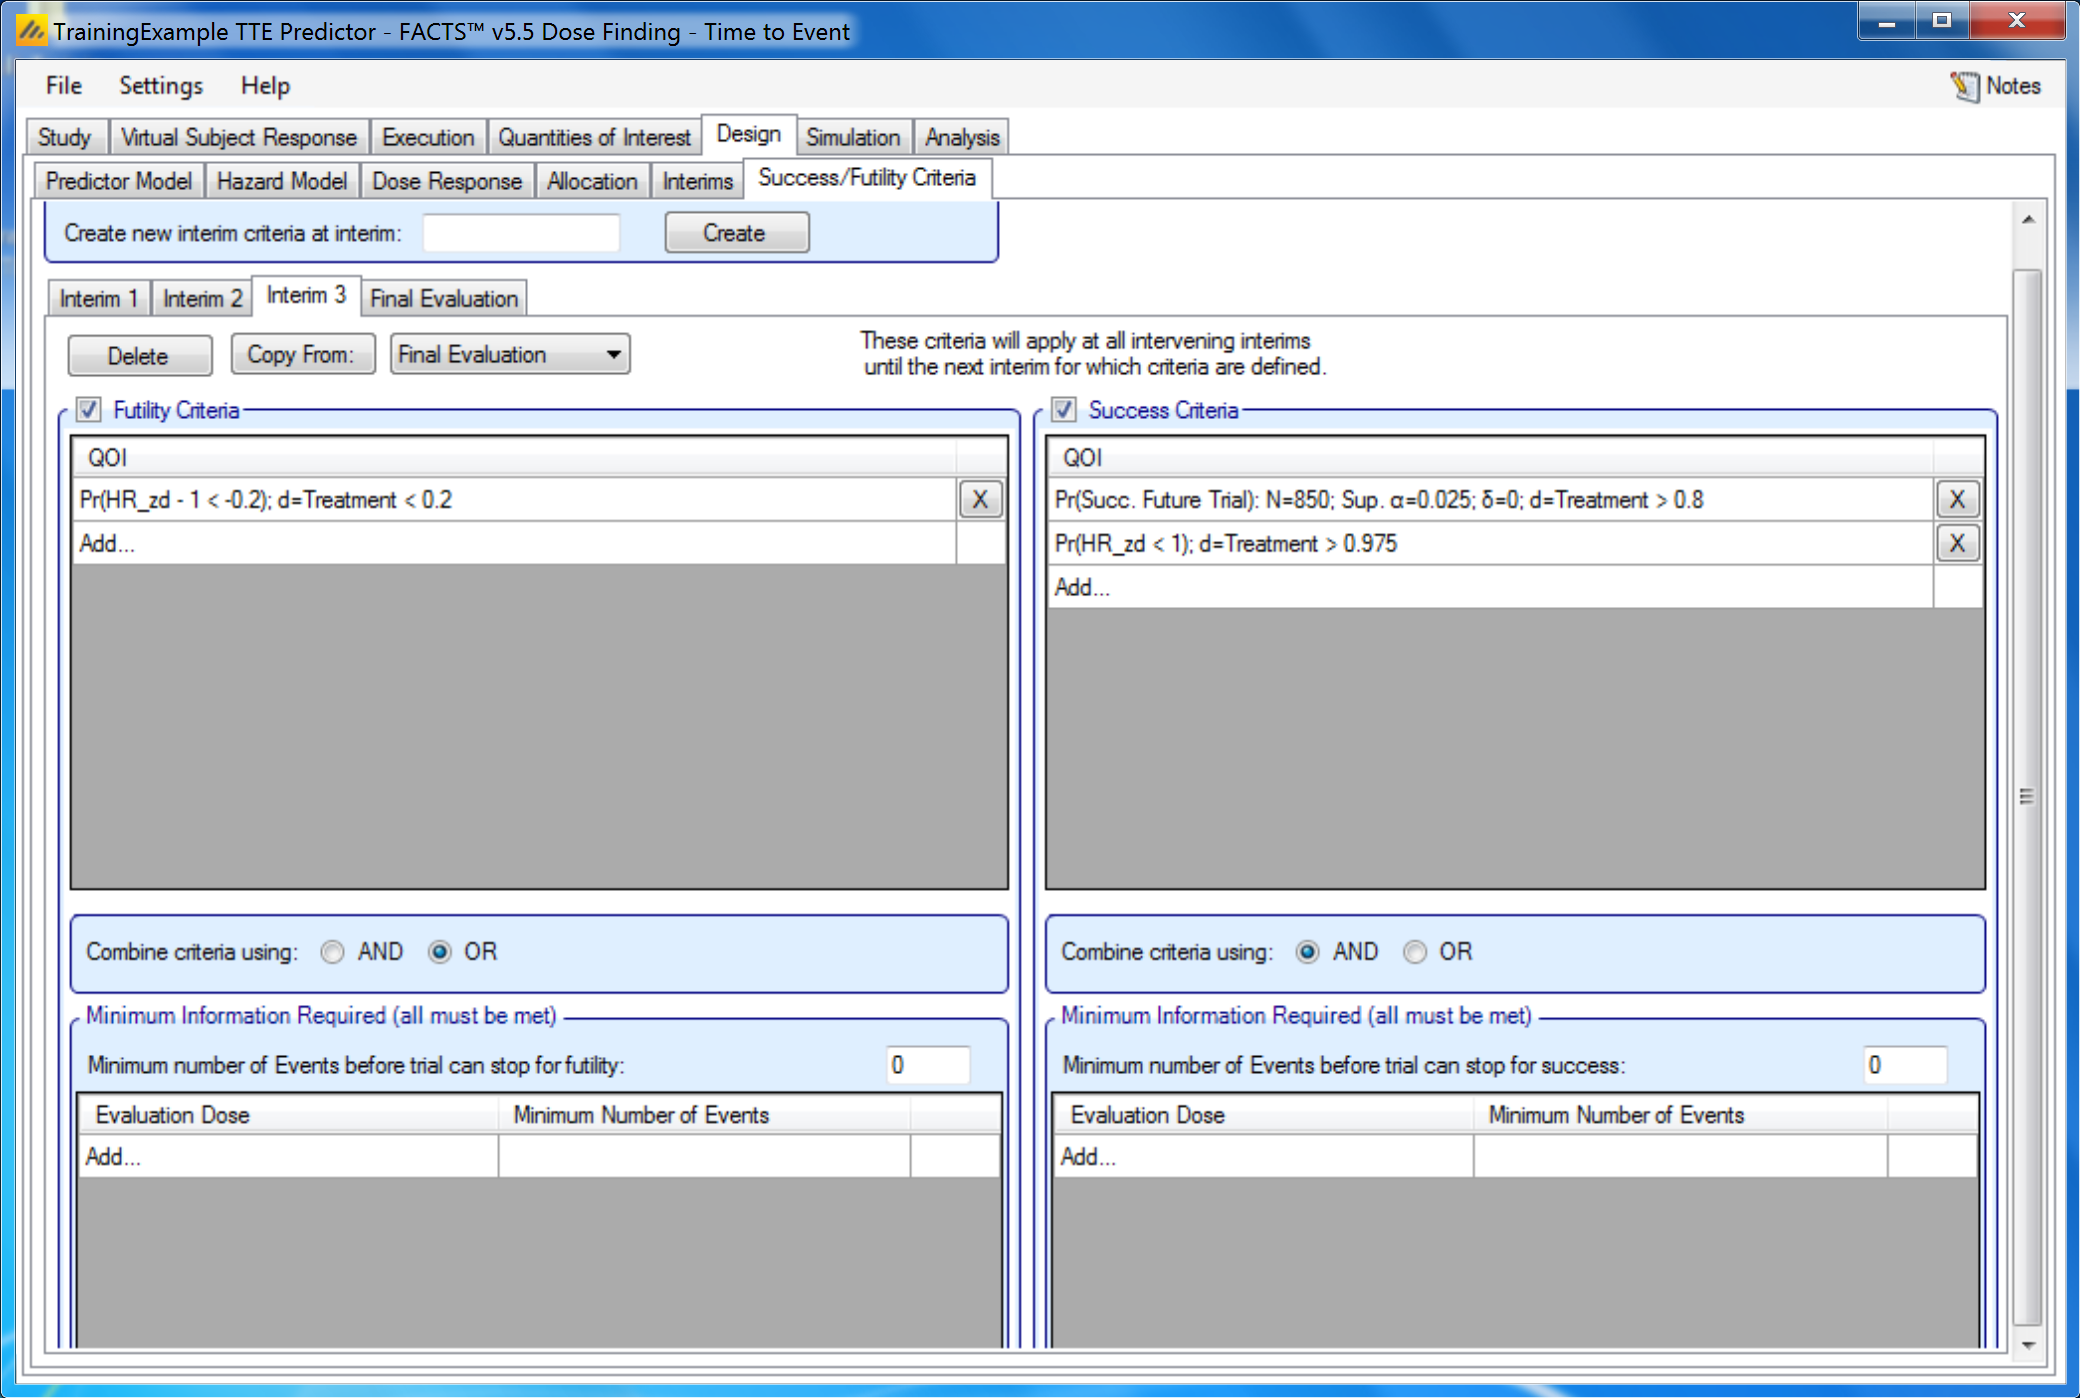
We base early stopping for futility on the minimally clinically significant hazard ratio (HR) of 0.80. If there is a low probability that the experimental therapy provides at least this benefit for EFS the trial may stop early for futility
We base early stopping for success on both the observed benefit for EFS and the likelihood that this benefit would translate to success in a phase III trial with OS as the primary endpoint. If, at an interim analysis we observe both superiority in terms of EFS and a high probability of success for in a future phase III trial, the trial may stop early for success
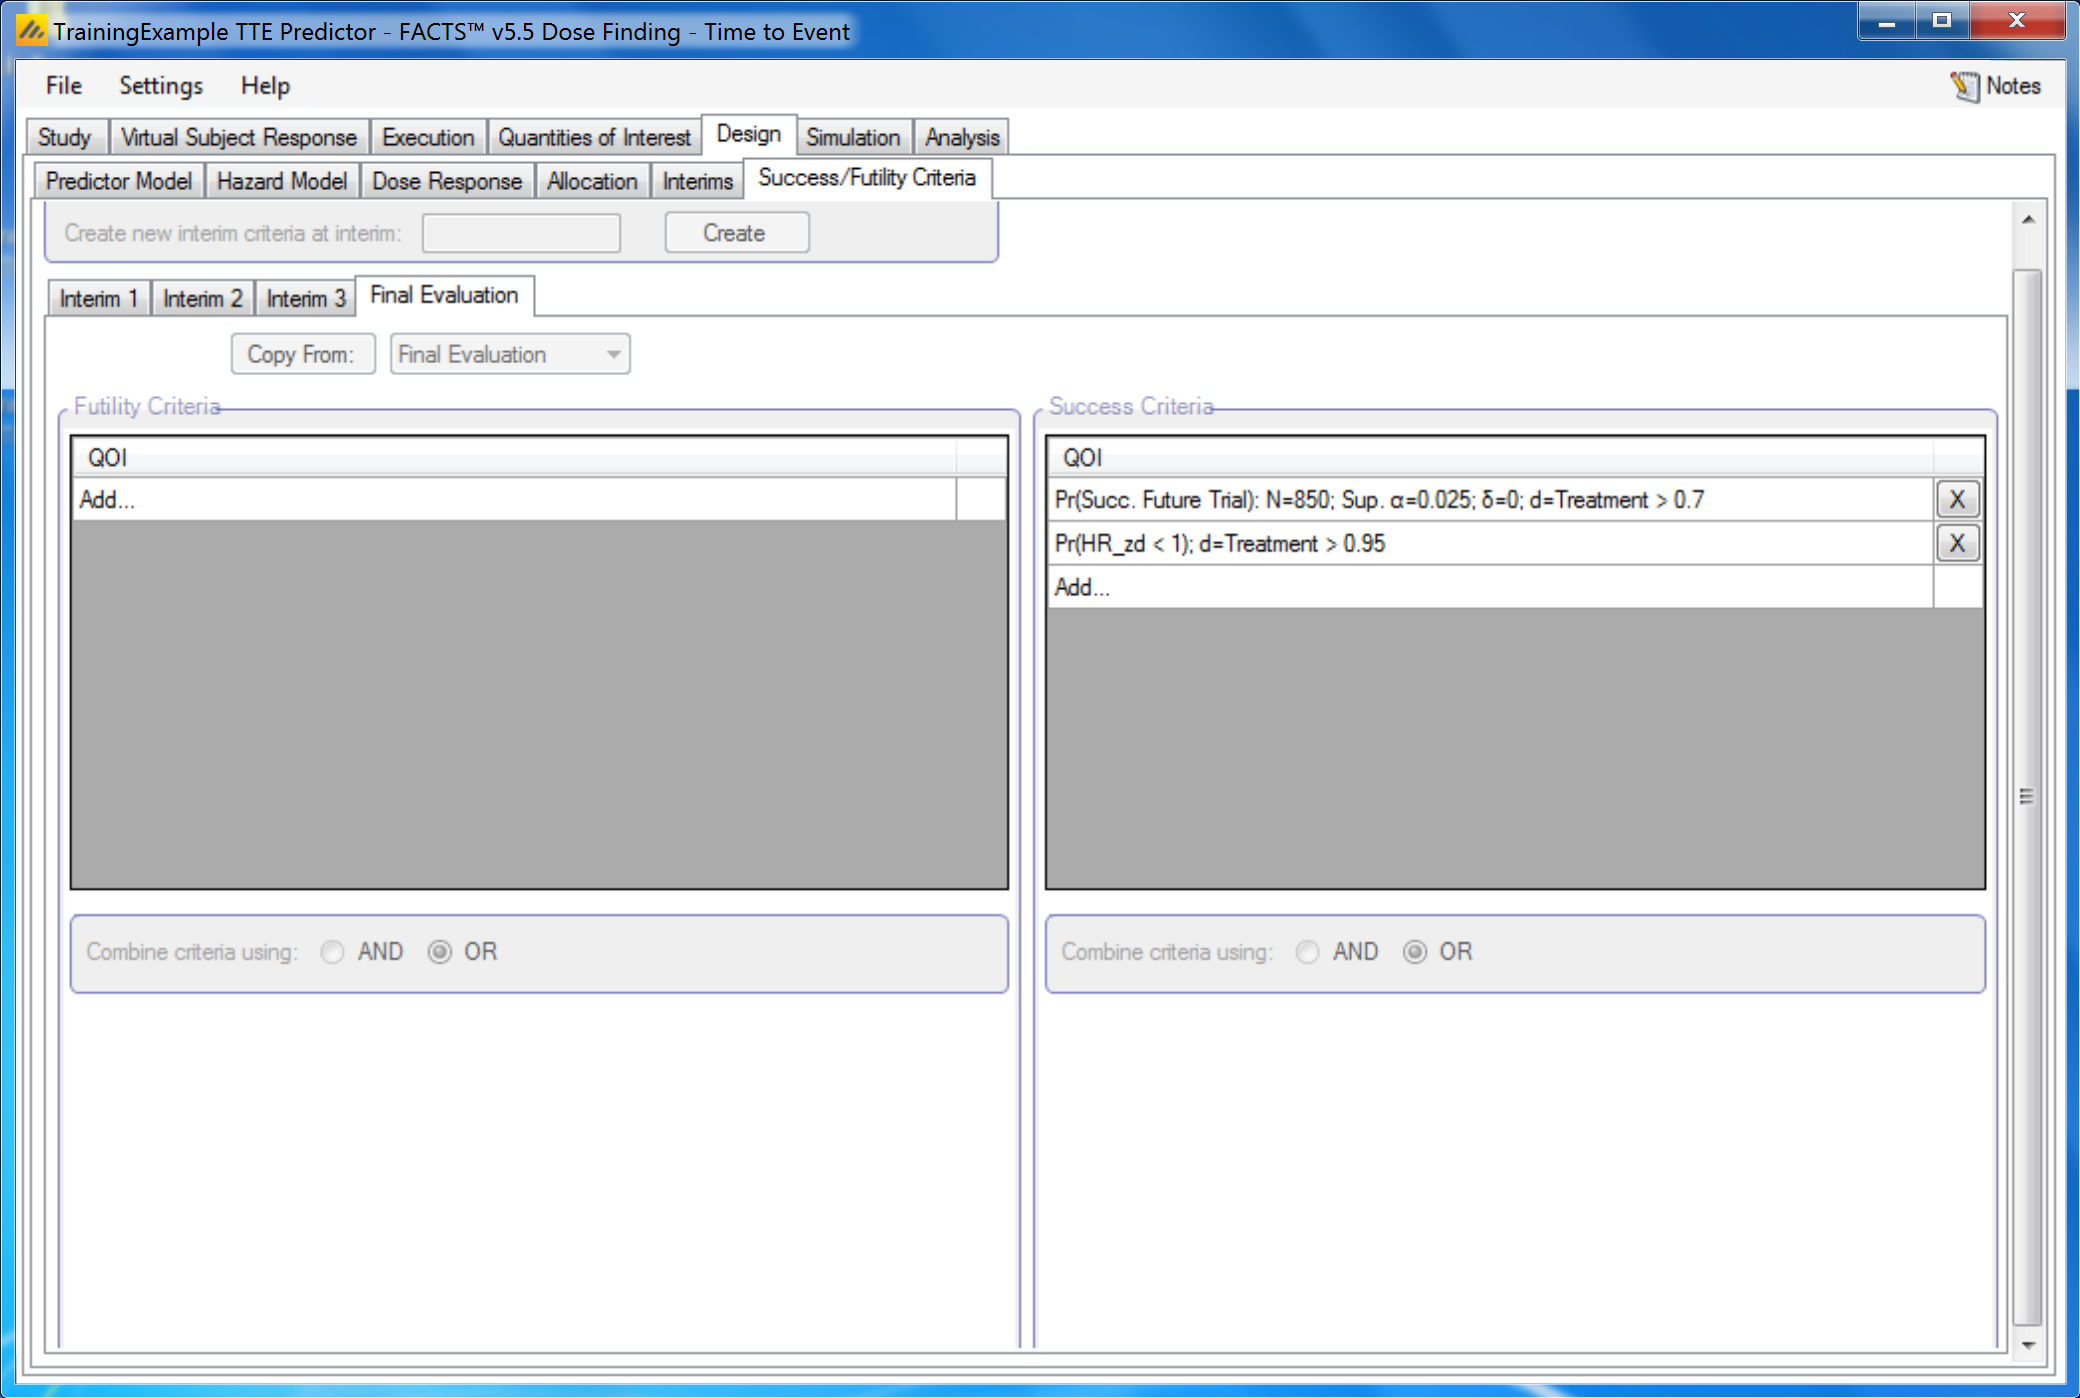
If the trial is not stopped early it will enroll to the maximum sample size of 350 patients and all enrolled patients will continue to be followed for an additional 36 months. At the final analysis, we evaluate only whether the new experimental therapy will be considered of interest for further study. Success at the end of the trial will be declared if either there is a high probability of superiority in terms of EFS or a high probability of success in a future phase III trial.
The critical values required for early stopping at each interim look as well as for declaring success should the trial continue to completion are shown in the table below. We require more extreme critical values for stopping early in the trial, with fewer observed events than later in the trial when more data has accumulated.
| n OS Events | Fn | EFS.Sn | OS.Sn |
|---|---|---|---|
| 32 | 0.15 | 0.99 | 0.95 |
| 65 | 0.15 | 0.98 | 0.85 |
| 98 | 0.20 | 0.975 | 0.80 |
| Final Analysis | - | 0.95 | 0.70 |
3 Simulation and Results
3.1 Results
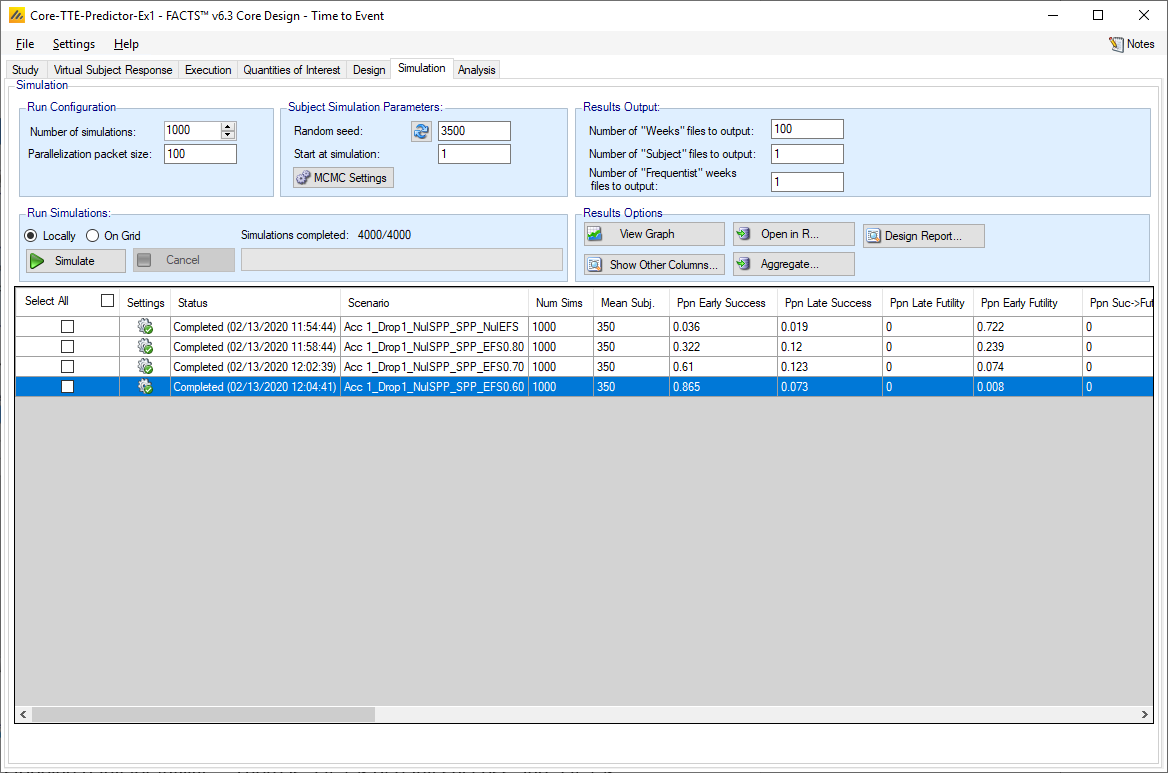
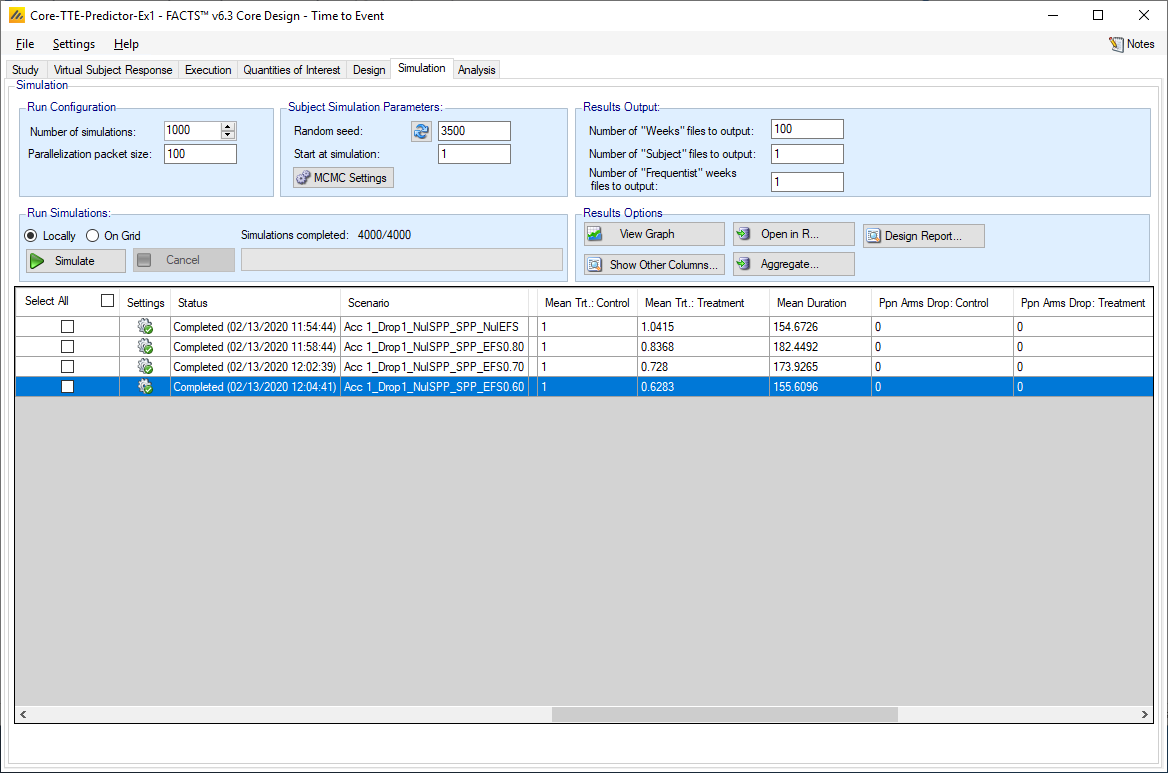
In the null scenario, there is a 72.2% probability of stopping early for futility. There is a 3.6% of early success and a 1.9% probability of declaring success at the final analysis. Therefore, the total probability of success under the null for this phase II trial is 5.5%.
We assess the operating characteristics of the trial here based on 1000 simulations. Most trials enroll to the maximum sample size of 350 patients. In the null scenario, where trials tend to stop early for futility, and in more optimistic EFS HR scenarios where trials tend to stop early for success, the total trial duration is shorter.
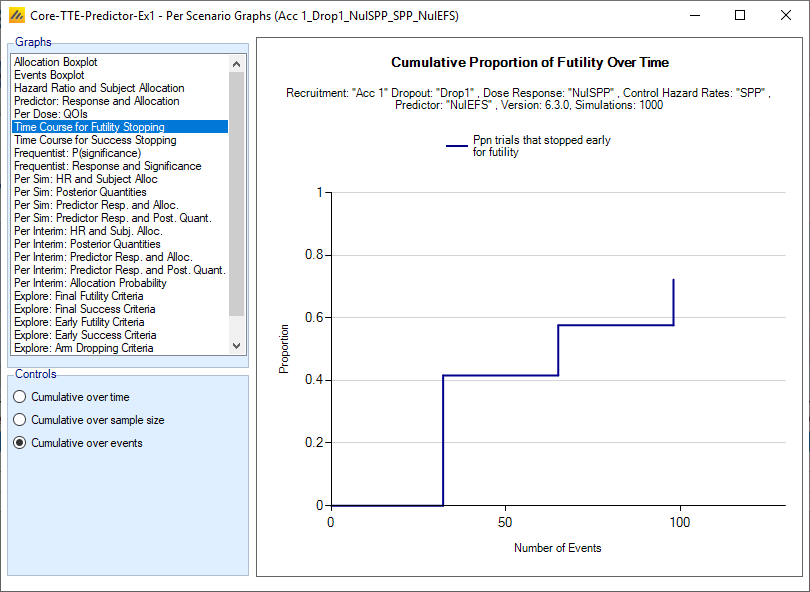
3.1.1 Plots
This plot shows the cumulative probability of early futility stopping at each interim analysis under the null scenario. There is >40% probability of stopping at the first interim analysis and an additional 20% probability of stopping at the second interim analysis.
When the EFS HR is 0.70, this trial has a 61.5% probability of early success and a 17.4% probability of success at the final analysis. Therefore, the total probability of success in this scenario is 78.9%.
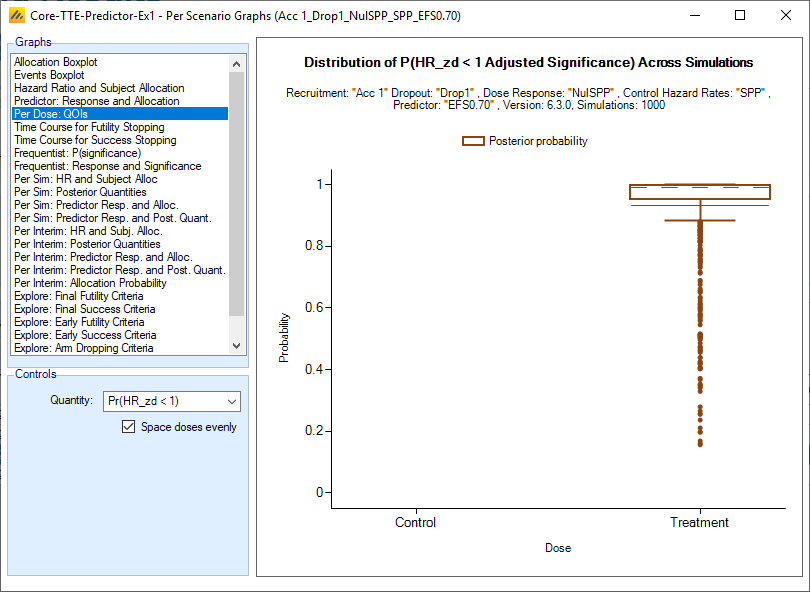
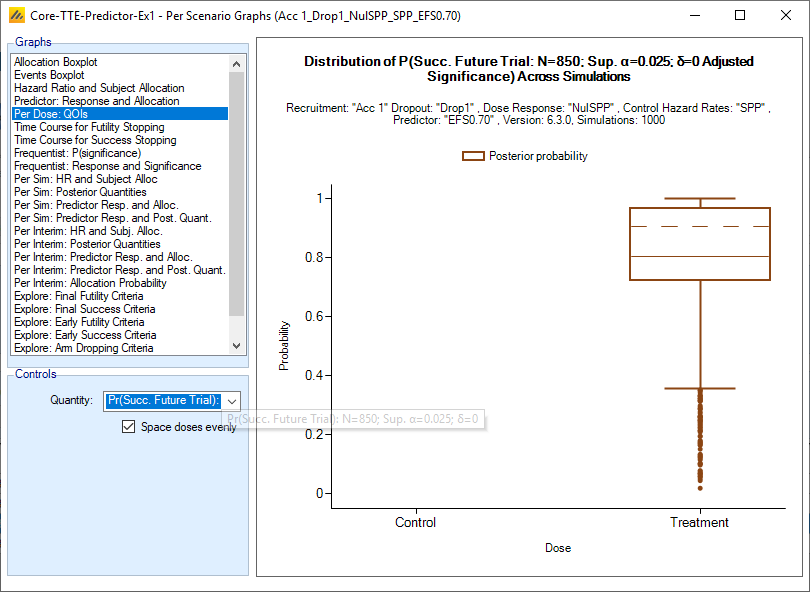
The following two plots show the distribution of the two QOI for success for the scenario where the HR on EFS is 0.7. We see the probability of superiority on EFS tends to be higher that the predictive probability of success in a future phase III.
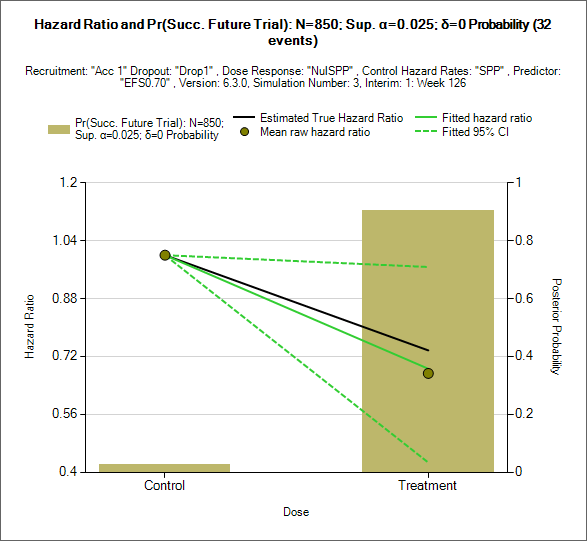
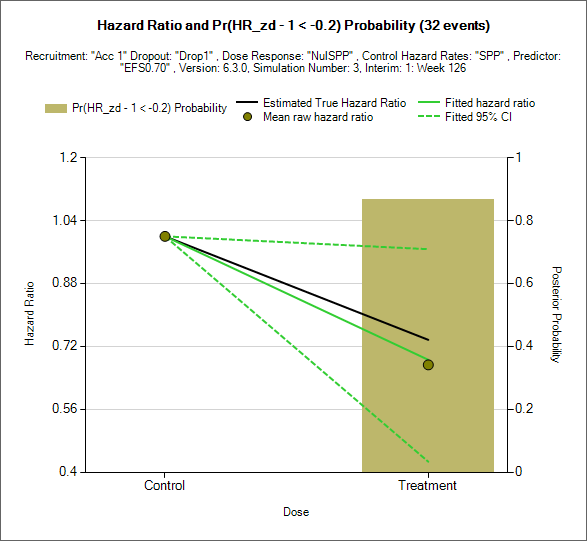
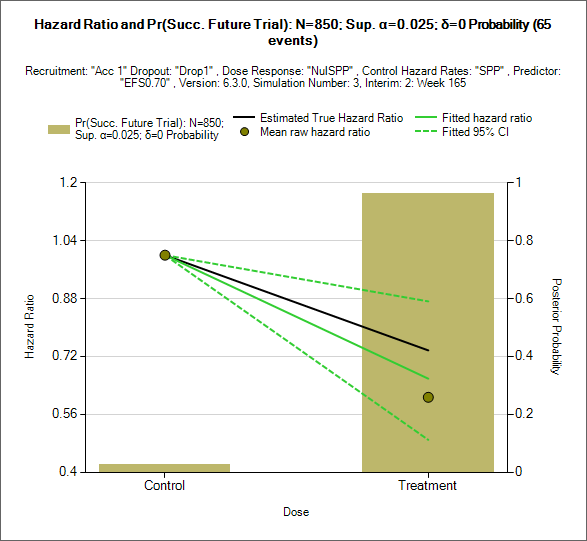
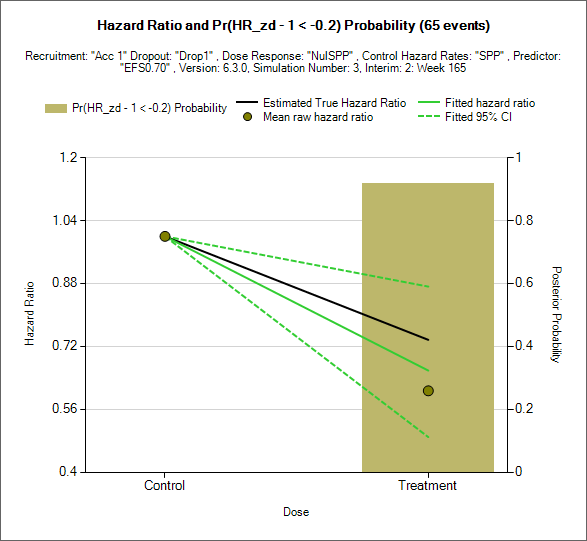
The following four plots show interim analyses from a single simulated trial that stopped early for success. We show the interim analysis at 32 events and then at 65 events. The left plot shows the probability of success in a future phase III trial and the right plot shows the probability of superiority for EFS. In this example, we observe a large benefit. At the first interim analysis, the two QOIs are not quite high enough to stop early for success, but they are at the second interim analysis.